49 Photos
Last Updated : 14 Hours ago


Like What you see?
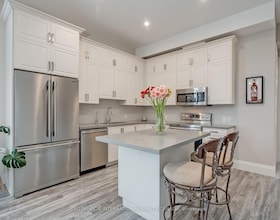
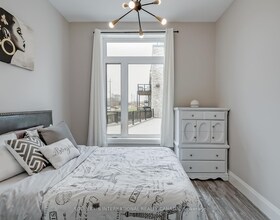
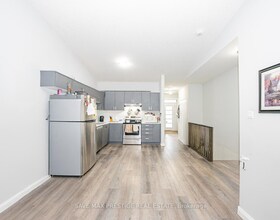
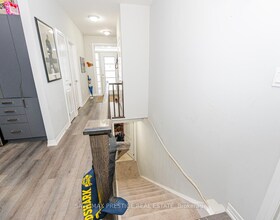
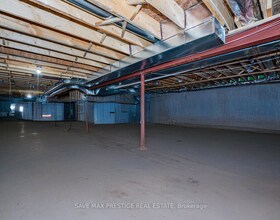
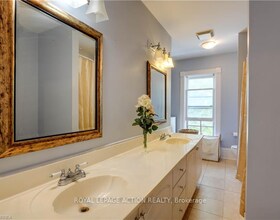
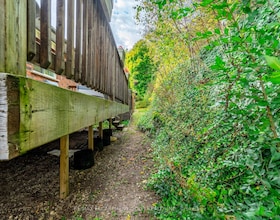
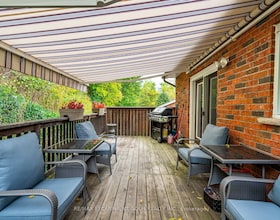
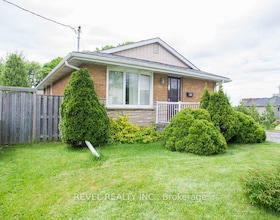
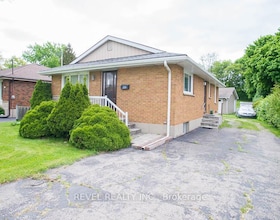
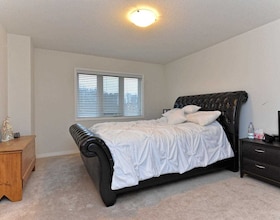
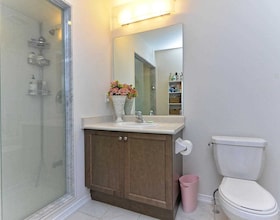
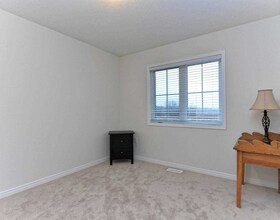
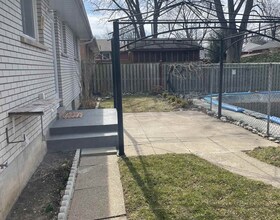
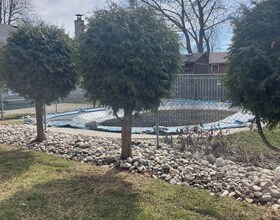
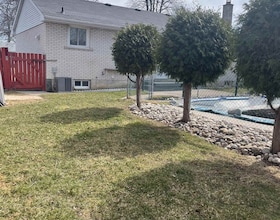
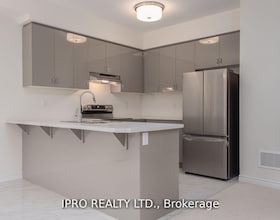
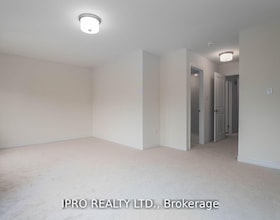
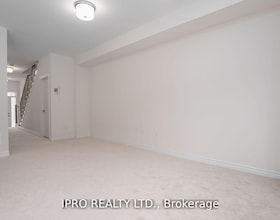
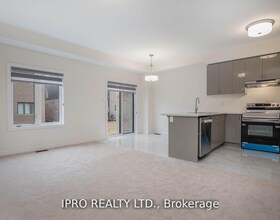
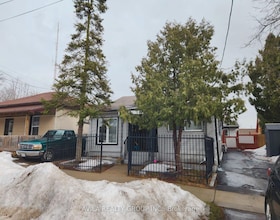
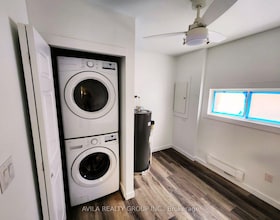
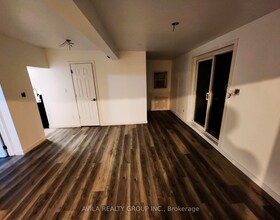
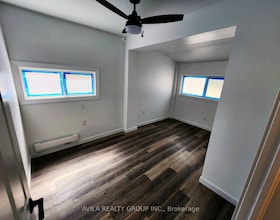
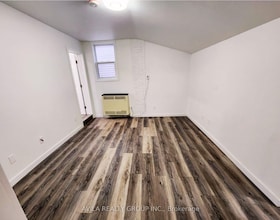
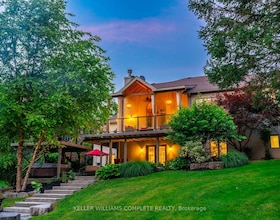
65 Holder Drive
Brantford, ON
MLS® X13489920
Residential Freehold (Att/Row/Townhouse)
$549888.0
- 3 +0 Beds
- 3 Baths
- 1500-2000 sq-ft
This is your opportunity to own a freehold home in the vibrant community of Brantwest. Built by Empire Homes this stunning three-storey freehold townh